Geographies: World wide
Simply Powerful:
ChartExpo™ is a Google Sheets Data Visualization tool that makes it simple to gain insights from your boring spreadsheets. Simple is not basic. Simple is powerful. When you solve a complex data problems with a simple chart or graph, the result is monumental. It is the “Aha!’ moment that seems so simple, yet produces such profound change. You can create network diagrams, flowcharts, comparison charts, sentiment graphs, survey graphs, PPC (Pay per click) charts using ChartExpo™.
Overwhelmed With Data, Starving For Insight:
Data is useless without insights. Your problem is not that you lack data. Your problem is that there is not enough time and resources to analyze your data for insights. Spreadsheets are helpful for collecting and organizing information, but fail to bridge the gap between your data and the insights you seek. You need to visualize your data. You need to chart the numbers.
Accessible Insights:
Manually analyzing data requires coding and endless clicking through spreadsheets. ChartExpo™ is effortless. You can create visualizations in three clicks. Insights that have always felt out of reach are now right at your fingertips.
Learn The Language Of Data:
Your data holds insights that are hidden behind the walls of spreadsheet numbers. Visualizations translate the language of numbers into charts that spark innovation. Visualizations enable fast comprehension because your eyes are better at absorbing visual information. Visualizing your data saves you valuable time.
Make Competitive Decisions:
Discover insights at a glance and accelerate your decision making and problem solving with visualizations. Become your competitors’ biggest threat with faster, smarter decisions, while they waste time and energy with manual analysis.
Find The Unexpected:
When you cut through the noise of chaotic data sets, you uncover new trends, relationships and patterns. Visualizations show you what you never expected to find. Start connecting the dots you
didn’t even know existed and find deeper answers in your data.
Share and Publish Charts:
• Download as PNG and JPG
• Embed charts in blogs or websites
• Post on social media
• Create presentations, dashboards & Reports from charts and graphs
Customize Charts with Ease:
ChartExpo™ for Google Sheets provides a rich properties framework to customize your charts, you can customize colors, fonts, styles, backgrounds etc. Save time preparing visualizations for your presentations, insert them directly into your Google Slides, and convey your message effectively—you don't need any design skills, only your data, and ideas.
ChartExpo™ for Google Sheets has a number of charts types that make it easier to find the best chart or graph for marketing reports and data analysis:
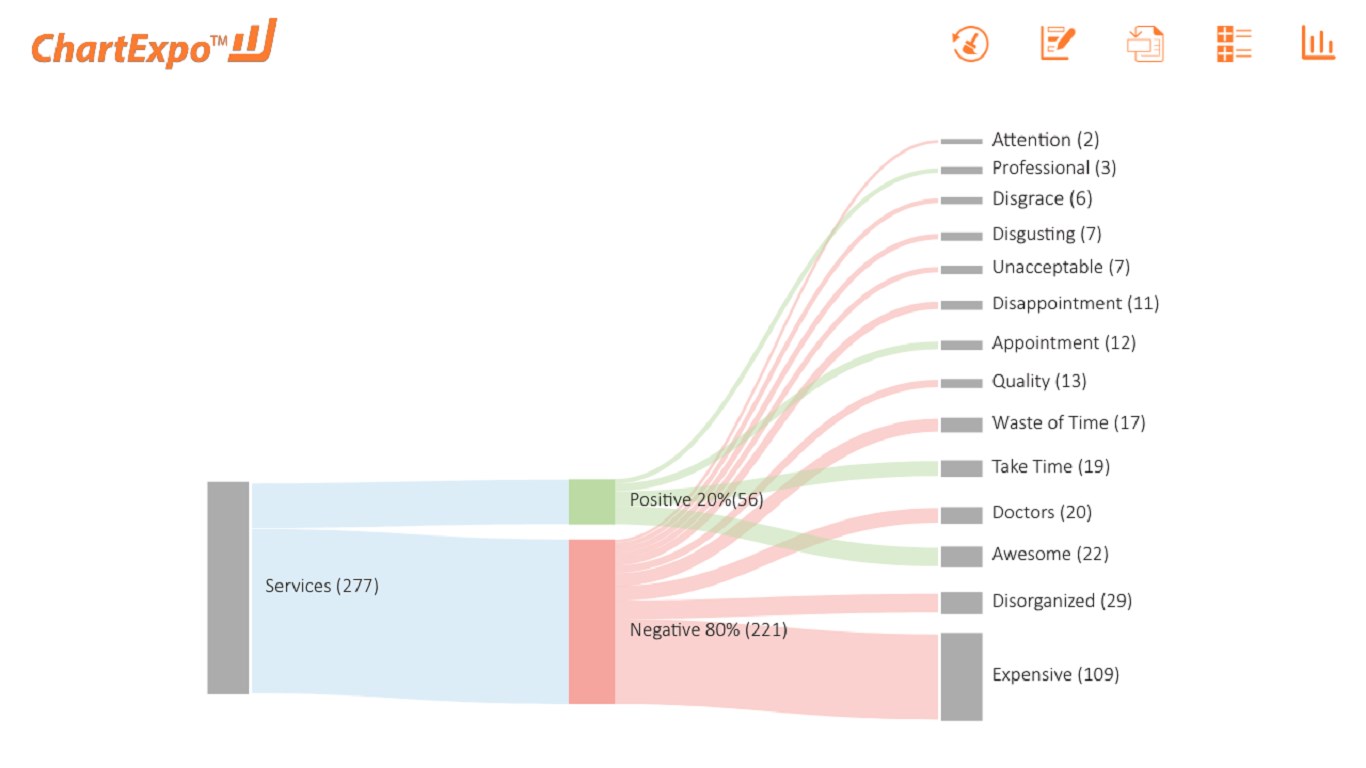
1. Sankey Diagram
2. Bar Charts
3. Line Graphs
4. Pie and Donut Charts
5. Slope Graph
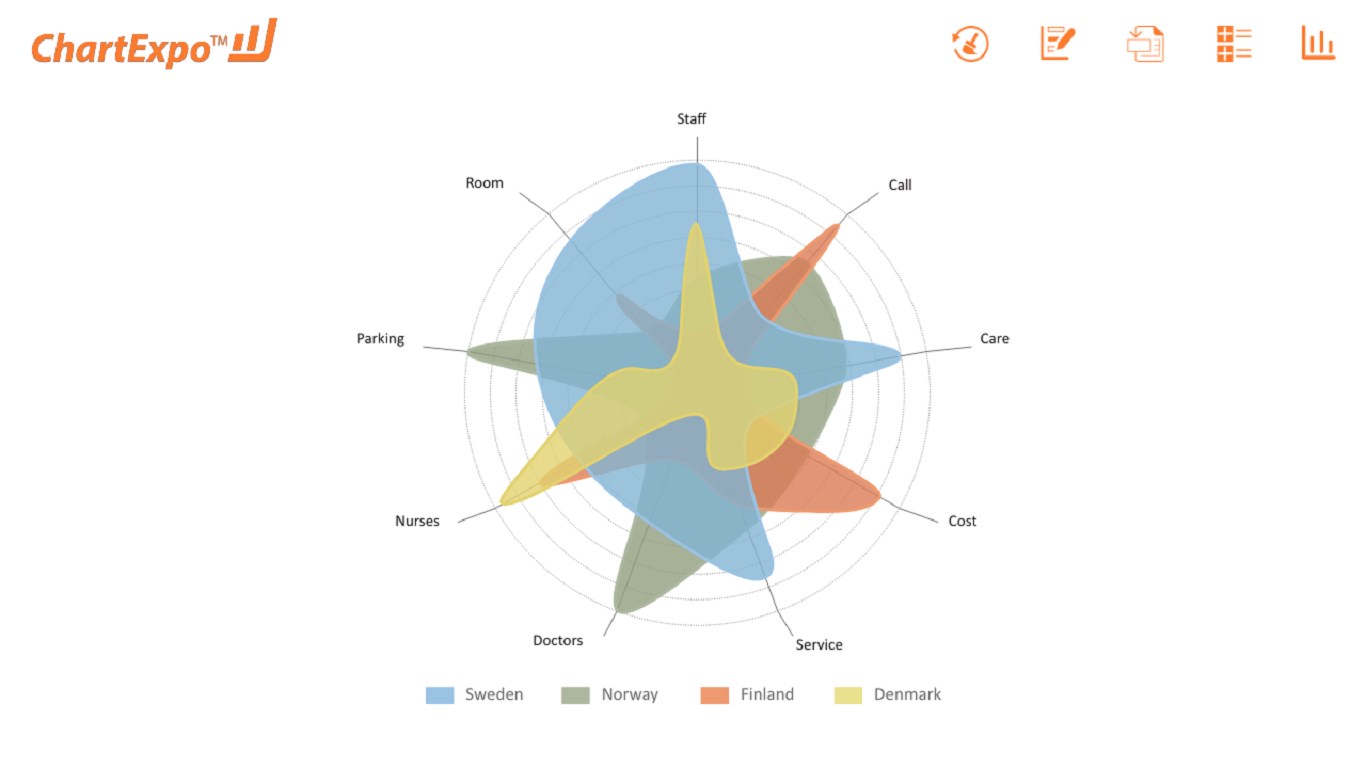
6. Radar Chart
7. Pareto Chart
8. Comparison Charts
9. Scatter Plot
10. Stacked Bar Chart
11. Stacked Column Chart
12. Area Charts
13. Treemap Chart
14. Gauge Chart
15. Sparkline Chart
16. Sunburst Chart
17. Rating Charts
18. Likert Chart
19. NPS Chart
20. Map Charts
21. Word Cloud and Tag Cloud
22. Chord Diagram
23. Dot Chart
24. Radial Chart
25. Partition Chart
26. Co-Occurance Chart
27. 24 Hour Chart
28. Funnel Chart
29. Progress Chart
30. NPS Detail Chart
31. Customer Satisfaction Chart
32. Sentiment Trend Chart
33. Dual Axis Line Chart
34. Multi Axis Line Chart
35. Multi Series Line Chart
36. Matrix Chart
37. Quality Score Chart
38. Performance Bar Chart
39. Crosstab Chart
ChartExpo™ is free for the first 7 days. After this no-risk trial, the service costs $10 per user per month. You can sign up from the add-on and use it for creating your daily reports and monthly reports.
Simplify your spreadsheets with ChartExpo™ Google Sheets Data Visualizations and see what you’ve been missing in your business reports. Visualize your data in few clicks and create management reports quickly.
Picture a Thousand Numbers.
See the Big Picture.
Startup Features:
- Design 50+ beautiful charts and graphs in no time. No coding required
- Create Charts in just few clicks
- Create Charts and Graphs without any coding skills
